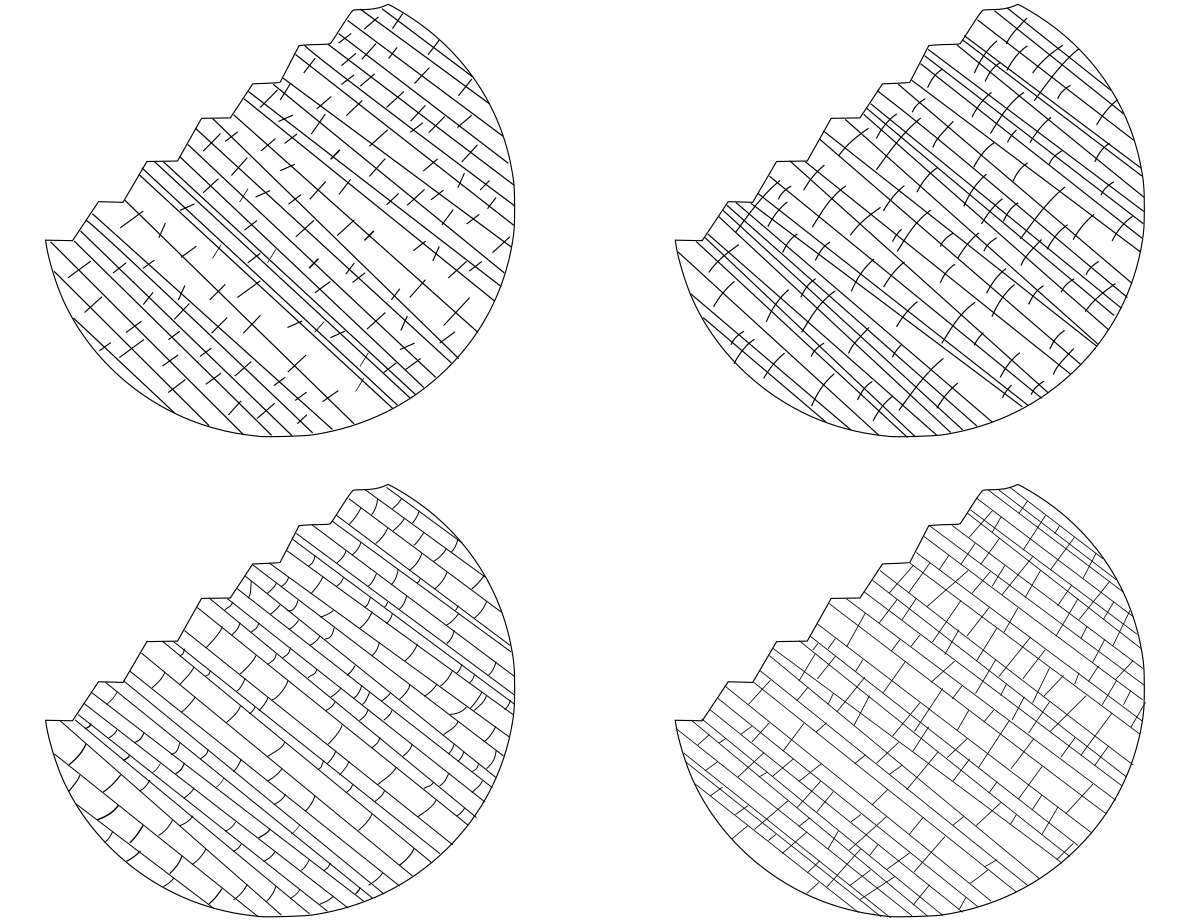
GMEK’s Technical Director Michael Munro had the privilege of presenting at the first BOHOGS technical meeting of 2024. Here is one of the slides from the presentation, focusing on the application of rock mass schemes to stability. Using the GSI as an example, the relevance of the scheme depends on the fractures distribution with respect to the excavation geometry.
While we can quantify excavation geometry, previous suggestions have been made to quantify fracture distribution or blockiness using methods like RQD. However, there are other parameters available for quantification in fractured rock masses.
In the diagram, there are four examples, each exhibiting the same P32 (or P21 in this 2D representation), which quantifies fracture persistence across a given dimension. The intention here isn’t to suggest quantifying GSI in this way, but to illustrate that relying solely on statistics is insufficient. Where here we see the same statistics in each diagram (P21 fracture persistence), we can also see there is more at play with respect to the fractures spatial clustering and relationships that can govern block geometries and slope behavior.
Key takeaways:
1. We have other methods to quantify fracture geometries with respect to excavations. This encompasses more than just persistence, extending to methods for assessing additional features such as spacing or clustering, connectivity, geologic relationships, and block attributes.
2. When modelling fractures, it’s important to understand that it’s not all about bootstrapping models to statistics. Where the additional characteristics mentioned above are linked to geological and geomechanical drivers, we cannot expect a satisfactory DFN if the basic inputs are not related to the processes and relationships observed in nature, which is the target of DMX. See more: https://lnkd.in/gUPQVVRE

